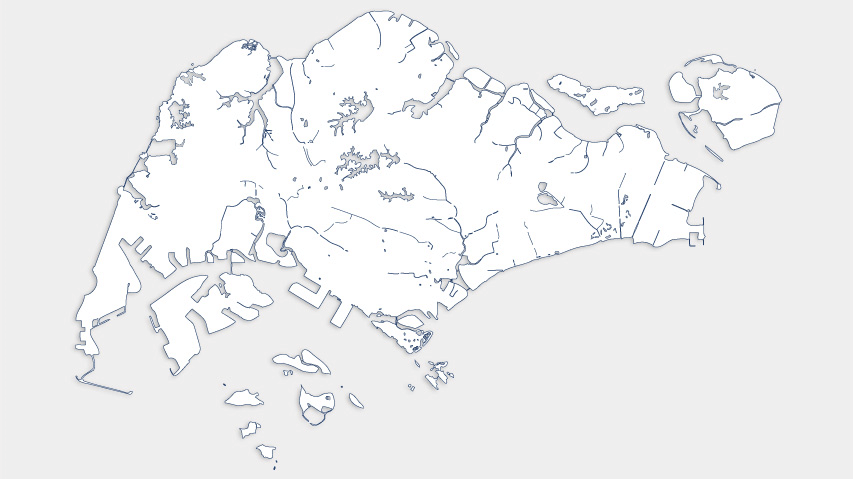
No frame at this minute
rain heavy no rain NEA forecast, not this site's.
NEA 24-hour forecast
Loading…
The official forecast, read live from NEA's data.gov.sg API. NEA is not associated with this site and does not endorse it.
Rain intensity
lightheavy
Reading the strip
- Observed
- Radar, mirrored every five minutes. Where a prediction covers the same minute, the radar wins.
- Predicted
- Five-minute steps to two hours ahead.
- Predicted, coarse
- Half-hour steps to four hours. The model thins out here, and so does the strip.
- Confidence veil
- How sure the model is, drawn as the rain's own transparency. On a predicted frame the veil is on by default: a cell that might rain fades toward the coastline, so the picture is probability past ninety minutes. Turn off Confidence for the confident picture.
Bar height is how much of the frame is wet; bar colour is how heavy that rain gets. The baseline goes dashed at now.
This forecast
- Anchor
- —
- Made
- —
- Run
- —
- Grid
- —
The anchor is the newest radar frame with a complete hour of history behind it — the last thing the model saw, and the picture at 0 min.
— draw predicted rain at its own probability.
How the prediction is made
A neural network watches the last hour of radar — the close view over Singapore, and a wider one that catches storms still out at sea — and draws where the rain goes next. It learnt by being shown a long run of past radar alongside what actually happened after it.
What comes out is a probability, not a promise. Close in it is nearly certain, because five minutes from now the sky looks much like it does now. Further out it hedges, and the picture spreads and softens — that is the model admitting what it cannot know rather than a fault in the drawing. Past about ninety minutes, read it as where rain is likely, not how hard it will fall on one street.
It stops at four hours because that is where it stops being worth anything. Against simply knowing what the weather usually does at this hour, it is about 8% better one hour out and 6% better at four. By six hours the gain is nothing at all: the radar says no more than the clock already did.
Questions
Is it raining in Singapore right now?
The map opens on the newest radar frame, which is a few minutes old — the radar publishes on a five-minute grid and this site mirrors it as it lands. Anything to the left of the now line is observed rain, not a prediction.
Will it rain in Singapore in the next hour?
Drag the timeline past the now line and the map shows where the model expects rain, in five-minute steps out to two hours. Within the first half hour it is close to certain, because rain that is about to fall on you is usually already on the radar.
How accurate is the four-hour rain forecast?
Measured against simply knowing what the weather usually does at that hour, the model is about 8% better one hour out and 6% better at four hours. By six hours the gain is nothing at all, which is why the forecast stops at four. It is a probability rather than a promise: past about ninety minutes read it as where rain is likely, not how hard it will fall on one street.
Where does the radar data come from?
The 70 km rain-area radar product published by Singapore's National Environment Agency, mirrored every five minutes. NEA is not associated with this site and does not endorse it, and NEA publishes the official forecast.
How often does the rain forecast update?
A new run starts every five minutes, from the newest radar frame with a complete hour of history behind it. The page refreshes itself once a minute, so a tab left open stays current.
How does the rain prediction work?
A neural network reads the last hour of radar — the close view over Singapore, and a wider one that catches storms still out at sea — and draws where the rain goes next. It was trained on years of archived radar alongside what actually happened after it.
What do the colours on the rain map mean?
NEA's own 33-step rain-area scale, from cyan for the lightest rain through green and yellow to red and magenta for the heaviest. Predicted frames are painted in the same scale as observed ones, so both halves of the timeline read the same way.
Radar data from Singapore's National Environment Agency. NEA is not associated with this site and does not endorse it. The predictions are ours, made by a model — they can be wrong, so do not treat them as fact. NEA publishes the official forecast. All times SGT.